Debugging is putting the execution of code at pause and continuing to run the code either line by line or some other way that you choose in manual fashion and managed by you.
Table of Contents
Why Would You Debug The Code?
There are several reasons why would programmer decide to do debugging of code and here are few:
- to troubleshoot the errors and to help determine the cause of an error.
- to see how code runs and understand it better, especially if you are not the one who wrote it in the first place.
NOTE: If you want to learn more about Error Handling please read How To Log PowerShell Errors And Much More
Useful Keyboard Shortcuts
While you are debugging the code the fastest way to navigate is by using the keyboard shortcuts so it is very important to know them. Here is a short table of the most important keyboard shortcuts while debugging.
| Command | Keyboard Shortcut | Console Pane Shortcut |
|---|---|---|
| Toggle Breakpoint | F9 | |
| Run/Continue | F5 | Type C and then press ENTER to continue debugging |
| Step Into | F11 | Type S and then press ENTER to continue debugging |
| Step Over | F10 | Type V and then press ENTER to continue debugging |
| Step Out | Shift + F11 | Type O and then press ENTER to continue debugging |
| Stop Debugger | Shift + F5 | Type Q and then press ENTER to continue debugging |
| Remove All Breakpoints | Ctrl + Shift + F9 | |
| List Breakpoints | Ctrl + Shift + L | |
| Display Call Stack | Ctrl + Shift + D | Type K and then press ENTER to continue debugging |
| Break All | Ctrl + B | |
| Go to Console Pane | Ctrl + D | |
| Go to Script Pane | Ctrl + I |
How To Debug PowerShell Scripts
To debug PowerShell script follow these easy steps:
- In order to set breakpoints in the script that you want to debug you need to save it first. An unsaved script cannot set breakpoints.
- Now you want to set one or more breakpoints by selecting the line of code where you want to place the breakpoint and then right-click mouse and click on “Toggle Breakpoint” or press F9 or go to menu Debug and click on “Toggle Breakpoint”.
- Run the code by pressing F5 or make a call to the script and the code will run as usual until it reaches breakpoint that will switch to debugging mode and we can go through the code to debug it.
- We can continue line by line by pressing F11 – Step Into. If the current statement is a function or a script call, then the debugger steps into that function or script, and we can continue debugging in that function.
- If we want to avoid debugging in function or script calls we can press F10 – Step over and we will not enter into function or script in debugging mode. This will be executed without debugging line by line and we can move one with debugging in the current function.
- If we want to remove breakpoint click on that line of code and press F9. Basically F9 is to turn on and off breakpoint on the line where is cursor or mouse point.
PowerShell Debugging Example
For this example, I will use my own CmdLets Get-CPUInfo and Get-ComputerInfo and they are part of the Efficiency Booster PowerShell Project. This project is a library of many awesome CmdLets that help us IT experts to be more efficient in our daily IT tasks. Please feel free to download the zip file with source code so you can follow along.
- Put a breakpoint (F9) in Get-CPUInfo CmdLet at line:
$computer = $env:COMPUTERNAME
- Make the call to Get-CPUInfo CmdLet using the following code in PowerShell ISE Code Pane and wait for a breakpoint to be reached.
Get-CPUInfo -client "OK" -solution "FIN"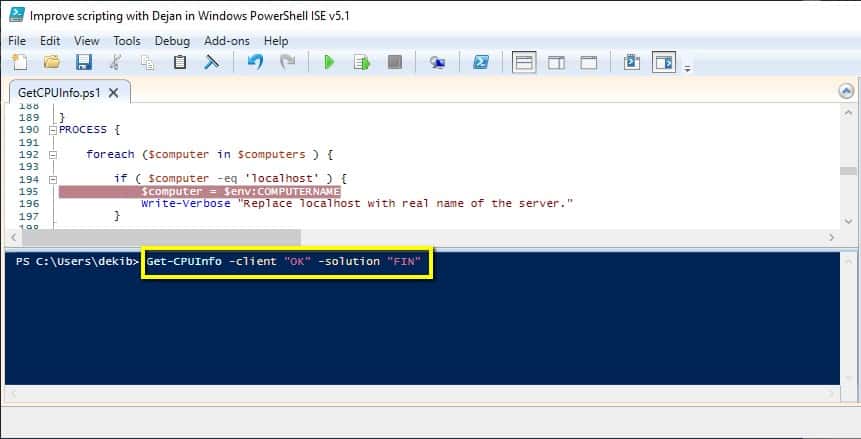
- Wait for execution to hit the breakpoint.
NOTE: It is important to notice a few visual indications in the Windows PowerShell ISE that tell us that the code is in debugging mode. Please read this section to learn about them.
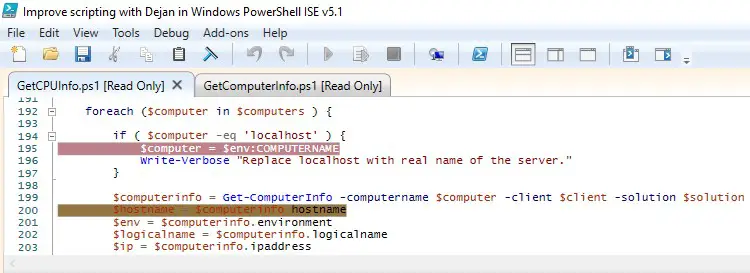
- Now we can Step into the code with F11
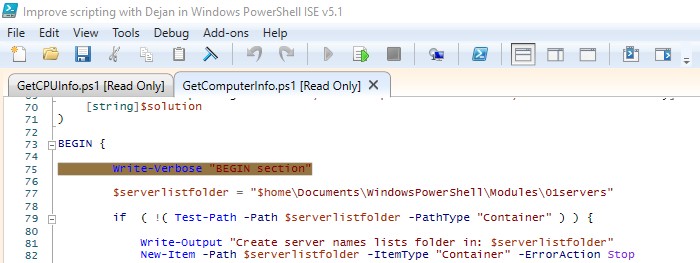
- When you come to the following line of code and press F11 you well step into Get-ComputerInfo CmdLet
$computerinfo = Get-ComputerInfo -computername $computer -client $client -solution $solution- Or we can press F10 to Step Over Get-ComputerInfo CmdLet and not to enter Get-ComputerInfo CmdLet. Debugging will continue on the next line in the Get-CPUInfo CmdLet.
- Press F11 to go line by line in Get-ComputerInfo CmdLet if you have picked the option not to Step Over Get-ComputerInfo CmdLet.
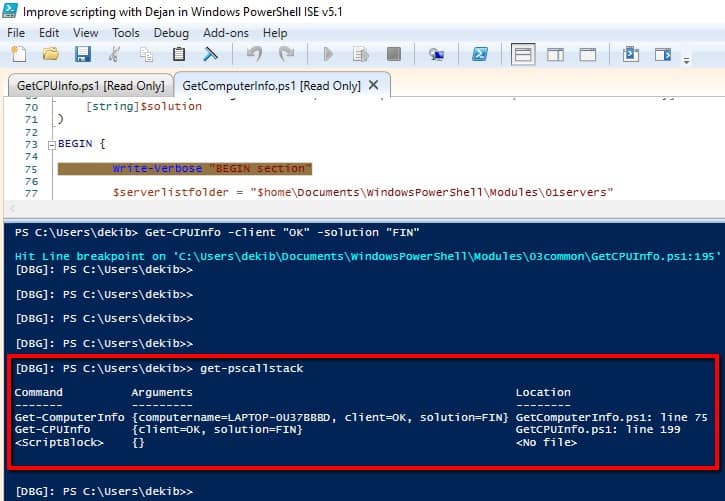
- While you are still in Get-ComputerInfo press Ctrl + Shift + D to get Call Stack
- Press Shift + F11 to Step Out from Get-ComputerInfo CmdLet and Come back to Get-CPUInfo if you do not want to debug line by line within Get-ComputerInfo CmdLet.
- When you come back to Get-CPUInfo CmdLet press again Ctrl + Shift + D to get Call Stack again.
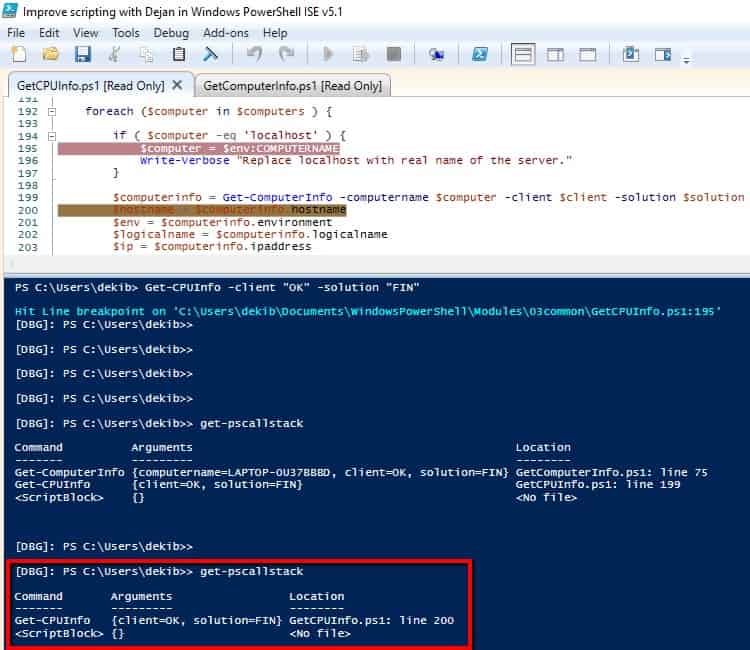
NOTE: Notice the difference between call stacks while we were in Get-ComputerInfo CmdLet and when we returned back to Get-CPUInfo CmdLet.
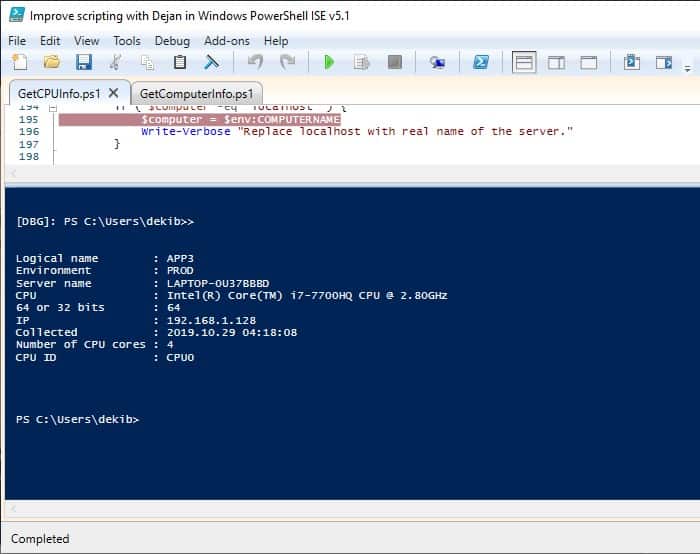
- Press F5 to continue execution. The execution finishes and we get our result
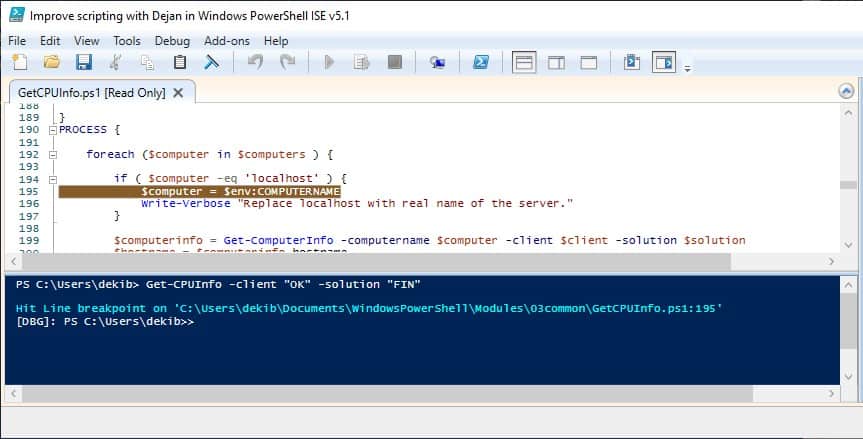
How Do We Know That Code Execution Is In Debugging Mode
We have some obvious visual indications that we have switched to Debugging Mode and here are some:
- All the tabs in Windows PowerShell ISE get [Read Only] next to the script name.
- The breakpoint highlights color has changed from red to brown.
- In the Console pane, it is written “Hit Line breakpoint…” or another type of breakpoint and
- We get [DBG] in front of the last line in Console Pane

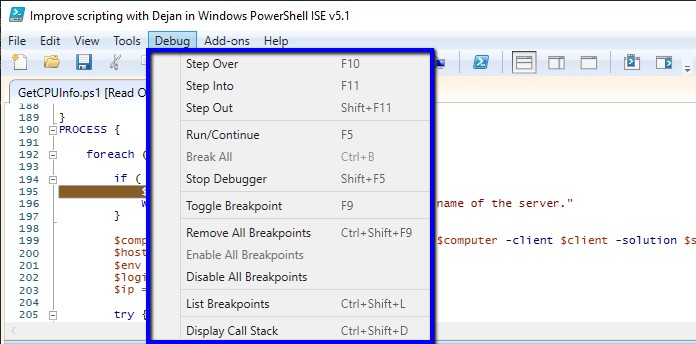
- Many menu items in the Debug menu are now enabled and we can use them for debugging the code.
What Are The Types Of Breakpoints
There are three types of breakpoints in the Windows PowerShell debugging environment.
| # | Type of breakpoint | Description | Environment to setup breakpoint |
|---|---|---|---|
| 1 | Line breakpoint | Execution of the script pauses when the designated line is reached. | Can be set in PowerShell ISE |
| 2 | Variable breakpoint | Execution of the script pauses when the designated variable’s value changes. | Use Set-PSBreakpoint CmdLet |
| 3 | Command breakpoint | Execution of the script pauses whenever the designated command, function or CmdLet is about to be run. | Use Set-PSBreakpoint CmdLet |
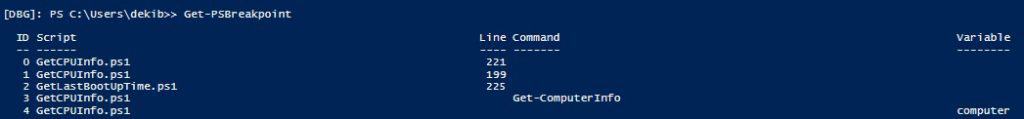
Here we can see all types of breakpoints listed in Console Pane using Get-PSBreakpoint CmdLet:
I have described how to set up Variable and Command breakpoints using Set-PSBreakpoint CmdLet in later sections with few nice examples so check it out following subheadings:
- How to set a breakpoint on a function or CmdLet (Command breakpoint)
- How to set a breakpoint for a variable in a function (Variable breakpoint)
- How to Set a breakpoint depending on the value of a variable (Variable breakpoint)
How To Manage A Debugging Session
REMEMBER: Even before starting debugging your script, save it first, then set one or more breakpoints and you are ready to start debugging.
How To Start Debugging
There are several ways to start debugging:
- Click on Run Script icon on the toolbar.
- Press F5 key shortcut.
- Go to the Debug menu and click Run/Continue.
The script will run until it encountered the first breakpoint. It pauses execution there and highlights the line on which it paused. In Script pane all the open tabs will have [Read Only] next to the name of the script. In the Console pane, we will get information that execution Hit Line breakpoint with [DBG] starting next line meaning that we are in debugging mode right now.
How To Continue Debugging
There are several ways to continue debugging:
- Press F5 key shortcut.
- Go to the Debug menu and click the Run/Continue.
- Click on Run Script Icon in the toolbar.
- In Console Pane, type C and then press ENTER.
How To View The Call Stack
There are several ways to view the call stack:
- Press Ctrl + Shift + D.
- Go to the Debug menu and click on Display Call Stack.
- In Console Pane, press K and then press ENTER.
- Run Get-PSCallStack CmdLet like in the following example.
Get-PSCallStackHow To Stop Debugging
There are several ways to stop debugging:
- Press Shift + F5.
- Go to the Debug menu and click Stop Debugger.
- In Console Pane, type Q and then press ENTER.
How To Step Into, Step Over, Step Out And Continue While Debugging
When the breakpoint is hit and execution of code has paused and the Windows PowerShell ISE environment is in debugging mode we as developers have several options to step through the code and see what is happening.
Debugging Task: Step Into
Description: The difference between Step Into and Over is that Over when executes statement that is function or script call will not step into that function or script but rather execute them and continue to next statement within the current code. Basically we are not leaving the current function. This is very useful when there is no need to step through the other functions or scripts and stepping of code is much faster.
How to accomplish it in PowerShell ISE:
- Press F10 keyboard shortcut.
- Go to the Debug menu and then click on Step Over.
- In the Console Pane, Type V and then press ENTER to continue debugging.
Debugging Task: Step Out
Description: Step Out is a very useful option if we are in nested functions and we can easily step out from nested functions and return to the main function. Use Ctrl + Shift + D keyboard shortcut to check if the current code statement is in the nested function (We are checking the Call Stack basically). If we are in the main body of the function than script executes to the end, or to the next breakpoint. We do not step through the skipped statements but rather executes them.
How to accomplish it in PowerShell ISE:
- Press Shift + F11 keyboard shortcut.
- Go to the Debug menu and then click on Step Out.
- In the Console Pane, Type O and then press ENTER to continue debugging.
Debugging Task: Continue
Description: Continues execution to the end, or to the next breakpoint. The skipped functions and invocations were not stepped through but rather executed.
How to accomplish it in PowerShell ISE:
- Press F5 keyboard shortcut.
- Go to the Debug menu and then click on Run/Continue.
- In the Console Pane, Type C and then press ENTER to continue debugging.
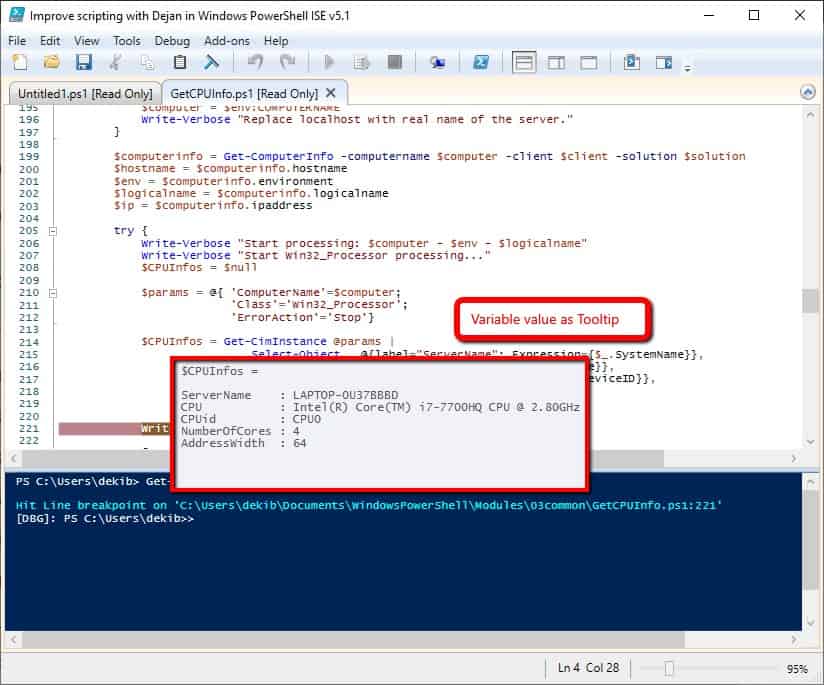
How To Display The Values Of Variables While Debugging
To display the values of standard variables use one of these methods:
- Script pane, hover over the variable to display its value as a tooltip
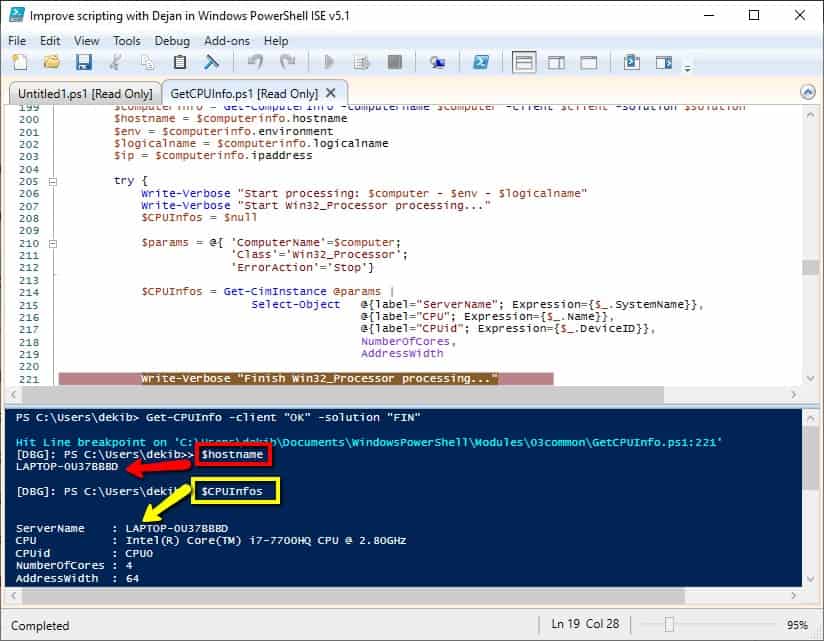
- Console pane, type the variable name and press ENTER
To display the values of almost all automatic variables use the same methods.
Previously mentioned methods apply for most automatic variables but for following automatic variables doesn’t apply:
- $_
- $Args
- $Input
- $MyInvocation
- $PSBoundParameters
If you try to display the value of any of these variables, you will not get the value of the variable in the script but rather the value of the variable from an internal pipeline that the debugger uses.
The workaround is as follows:
- In the script, create a new variable and assign the value of the automatic variable
- Now you can display the value of the new variable using the same methods as for standard variables.
How To List Breakpoints
You have several ways to list breakpoints and get the result in Console Pane:
- Press Ctrl + Shift + L key shortcut (that will call Get-PSBreakpoint CmdLet).
- Go to menu Debug and pick List Breakpoints.
- Run Get-PSBreakpoint CmdLet in Console Pane.
As a result, you will get all the breakpoints from all scripts that have breakpoints.

If you want to see all breakpoints from certain script only use Get-PSBreakpoint with Script parameter pointing to the location where the script is located like in the following example:
Get-PSBreakpoint -Script .\Documents\WindowsPowerShell\Modules\03common\GetCPUInfo.ps1If you want to list certain breakpoint(s) use Get-PSBreakpoint with Id parameter like in these examples:
Get-PSBreakpoint -Id 0,2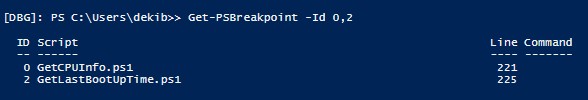
How To Set A Breakpoint On A Function Or CmdLet
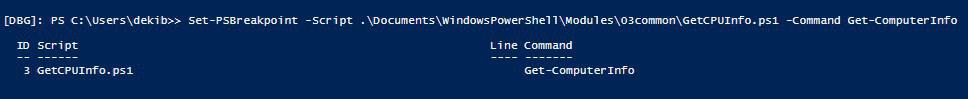
To set up a breakpoint on a function we use Set-PSBreakpoint CmdLet with Script parameter pointing to the script file and Command parameter with the name of function or CmdLet which call will hit the breakpoint.
In Get-CPUInfo CmdLet I have a call to Get-ComputerInfo CmdLet and if I want to set up a breakpoint when this CmdLet is called I do this with this command.
Set-PSBreakpoint -Script .\Documents\WindowsPowerShell\Modules\03common\GetCPUInfo.ps1 -Command Get-ComputerInfoSo when I call Get-CPUInfo CmdLet and execution of code comes to the line when a call to Get-ComputerInfo CmdLet needs to be executed we hit the breakpoint and PowerShell ISE switches to debugging mode. Now we can go through the code in Get-ComputerInfo CmdLet.
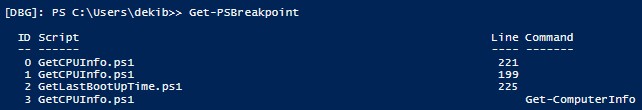
NOTE: Here we listed both line and command type of breakpoints.
How To Set A Breakpoint For A Variable In A Function
We should use Set-PSBreakpoint CmdLet with Script parameter pointing to the script file and Variable parameter with the name of the variable and we need to choose Mode like in example:
Set-PSBreakpoint -Script '.\Documents\WindowsPowerShell\Modules\03common\GetCPUInfo.ps1' -Variable "computer" -Mode Write
If we list again all breakpoints set so far we will see all the types of breakpoints: line, command, and variable.
Valid values for Mode parameter are:
- Write (default). Execution of code is stoped immediately before a new value is written to the variable.
- Read. Stops execution when the variable is read. In reading mode, the execution of code doesn’t stop when the value of the variable changes.
- ReadWrite. Execution of code is stoped when the variable is read or written.
How To Set A Breakpoint Depending On The Value Of A Variable
This is a very interesting option that might be useful in some special circumstances for example when some variable reaches certain value to activate the breakpoint and debug the code.
We use Set-PSBreakpoint CmdLet with parameters: Variable, Mode, and Action. A breakpoint has been created on a variable ‘sum’ when its value has been written to it and there is an action check to write the value of the variable and break the code when Command CallCounter is used and value of “sum” variable is greater than 15.
NOTICE: When the Counter function is used and the value of the “sum” variable is greater than 15 breakpoint action is not triggered and we do not hit a break of the code and do not enter debugging mode. Only when CallCounter function is used the breakpoint is hit.
Copy the following code in PowerShell ISE Script pane and run the code (F5):
Function Counter
{
Param ($limit = 10)
$sum =0
foreach ($i in 1..$limit)
{
$sum += $i
}
$sum
}
# Clear breakpoints
Get-PSBreakpoint | Remove-PSBreakpoint
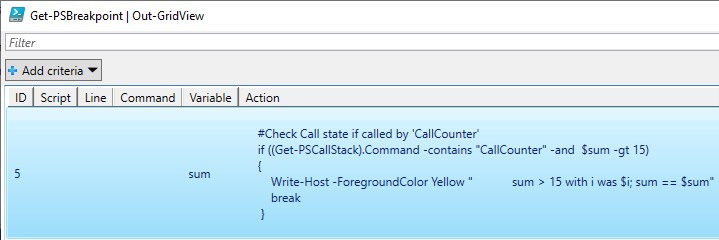
$bp = Set-PSBreakpoint -Variable "sum" -Mode Write -Action {
#Check Call state if called by 'CallCounter'
if ((Get-PSCallStack).Command -contains "CallCounter" -and $sum -gt 15)
{
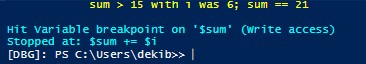
Write-Host -ForegroundColor Yellow " sum > 15 with i was $i; sum == $sum"
break
}
}
Counter
function CallCounter
{
Counter
}
CallCounterHere is a breakpoint message wrote to the host and hit of breakpoint after variable reached a certain value.
Run the following command to list the breakpoint:
Get-PSBreakpoint | Out-GridViewHere is the result:
How To Enable/Disable Breakpoints
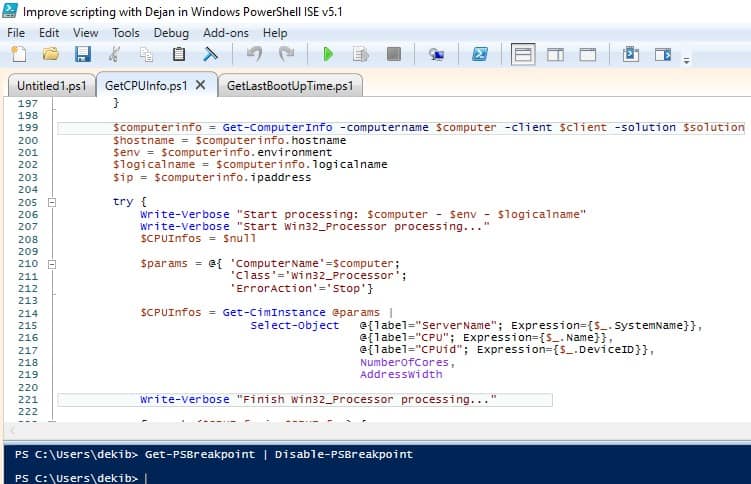
To disable all breakpoint run these commands:
Get-PSBreakpoint | Disable-PSBreakpointNOTE: After all breakpoints have been disabled the highlights color has changed from red into light blue in Script Pane so we can see visually that breakpoints are disabled.
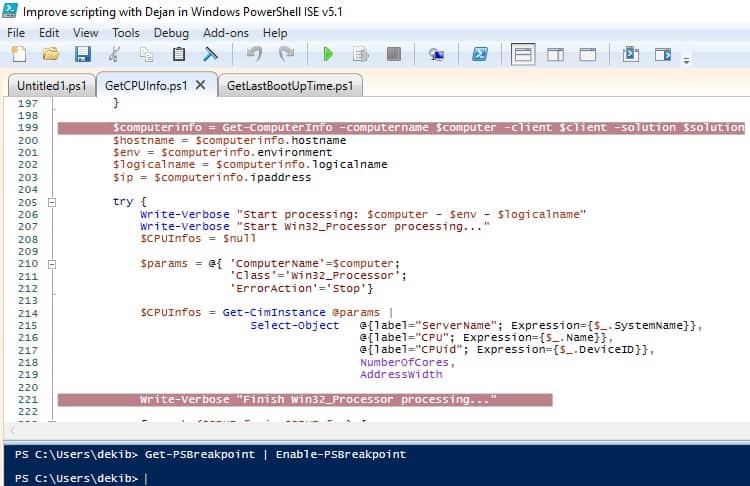
To enable all breakpoints to run these commands:
Get-PSBreakpoint | Enable-PSBreakpointNOTE: After all breakpoints have been enabled again the highlights color has changed from light blue back into red in Script Pane so we can see visually that breakpoints are enabled again.

We can enable/disable breakpoints by using their Ids.
Get the list of breakpoints Ids.
Get-PSBreakpointDisable breakpoints with Id values 1 and 3.
Disable-PSBreakpoint -Id 1, 3NOTE: We can even visually see that breakpoint id 1 is disabled (light blue) and breakpoint id 0 is enabled (red).
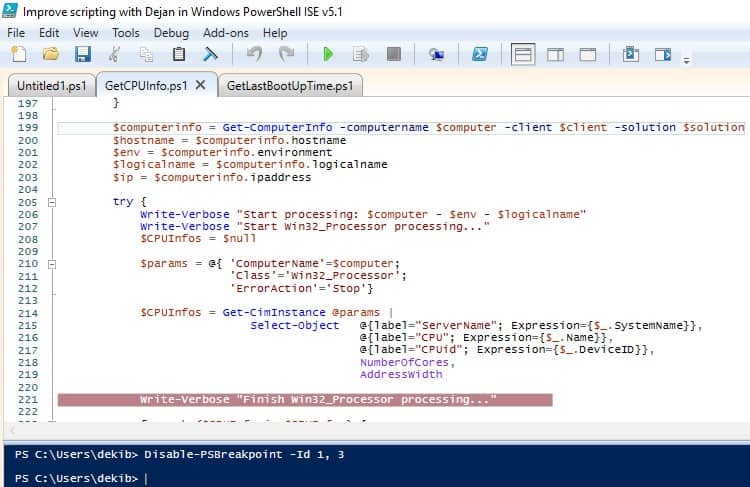
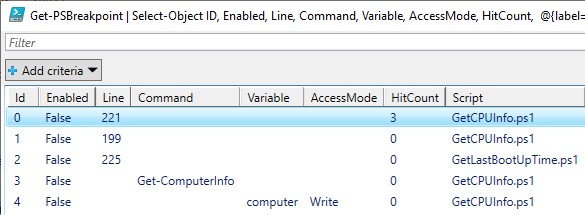
Look at the value for the Enabled column and Ids 1 and 3. It should be false and that means disabled breakpoint.
Get-PSBreakpoint | Select-Object ID, Enabled, Line, Command, Variable, AccessMode, HitCount, @{label="Script"; Expression={$_.Script.Substring( $_.Script.LastIndexOf("\") + 1 )}} | Out-GridView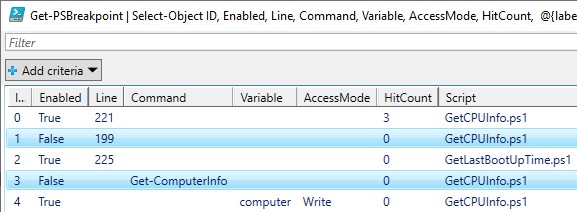
Re-Enable breakpoints with Id 1 and 3 again.
Enable-PSBreakpoint -Id 1, 3Here is a cool example that sets breakpoint first and saves the breakpoint as variable and then use that variable to pass thru to CmdLet to disable the breakpoint and then to re-enable the same breakpoint.
$B = Set-PSBreakpoint -Script '.\Documents\WindowsPowerShell\Modules\03common\GetCPUInfo.ps1' -Variable "computer"Disable breakpoint with PassThru parameter of Disable-PSBreakpoint
$B | Disable-PSBreakpoint -PassThruEnable the same breakpoint with PassThru parameter of Enable-PSBreakpoint
$B | Enable-PSBreakpoint -PassThruHow To Remove Breakpoints
Consider disabling the breakpoints before removing them since removing is destructive action and demands from you to set again breakpoints while disabling is the non-destructive and only thing to do is to enable it again in order to continue using the same breakpoint.
To remove all breakpoints we have these options:
- Go to Menu Debug and click on Remove All Breakpoints.
- Press key shortcut Ctrl + Shift + F9.
- Run the following commands in Code Pane.
Get-PSBreakpoint | Remove-PSBreakpointTo remove certain breakpoint we can move the mouse to that line of code and:
- Go to Menu Debug and click on Toggle Breakpoint.
- Press F9 keyboard shortcut.
- Right-click mouse on that line and click on Toggle Breakpoint.
To remove the breakpoint for a script we should use Get-PSBreakpoint CmdLet with Script parameter pointing to the script file and pipe the result to Remove-PSBreakpoint CmdLet like in the following example
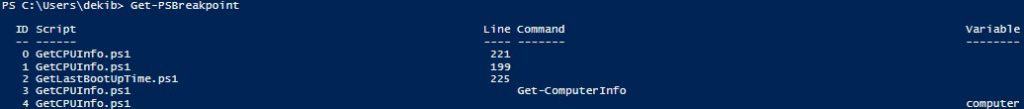
Get-PSBreakpointWe have 5 breakpoints that belong to two different scripts.
To remove breakpoints from Get-CPUInfo CmdLet script we run the following command:
Get-PSBreakpoint -Script .\Documents\WindowsPowerShell\Modules\03common\GetCPUInfo.ps1 | Remove-PSBreakpointIf we list the breakpoints again with Get-PSBreakpoint CmdLet we will see the only breakpoint from Get-LastBootUpTime CmdLet

How To Manipulate Breakpoints With Their Ids
In order to get Ids of breakpoints, we run Get-PSBreakpoint CmdLet.
Get-PSBreakpointNow when we know the Ids of breakpoints we can enable, disable, or remove breakpoints by their Ids.
To disable breakpoint with Id 4 we run following command:
Disable-PSBreakpoint -Id 4Use this to see the Enable status of breakpoints.
Get-PSBreakpoint | Select-Object ID, Line, Enabled, @{label="Script"; Expression={$_.Script.Substring( $_.Script.LastIndexOf("\") + 1 )}}To disable more breakpoints use Id parameter with Id values separated with a comma.
Disable-PSBreakpoint -Id 6,8To enable breakpoints to use Enable-PSBreakpoint CmdLet with Id parameter.
Enable-PSBreakpoint -Id 4,6,8To remove breakpoints use Remove-PSBreakpoint with Id values. (Removal is a destructive command so be careful running it).
Remove-PSBreakpoint -Id 4, 6Verbose Common Parameter
Verbose Common Parameter is not directly debugging but it can help us showing the workflow of our code execution. Personally I use the execution of CmdLet with Verbose when I need assistance where I need to put and turn on the breakpoints in the code.
Get-CPUInfo -client "OK" -solution "FIN" -Verbose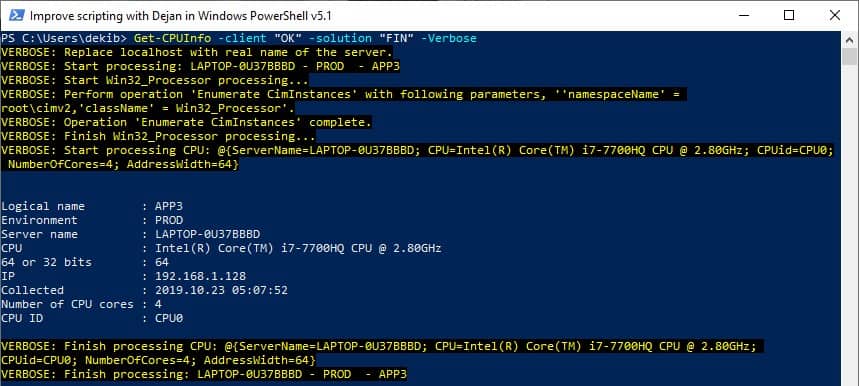
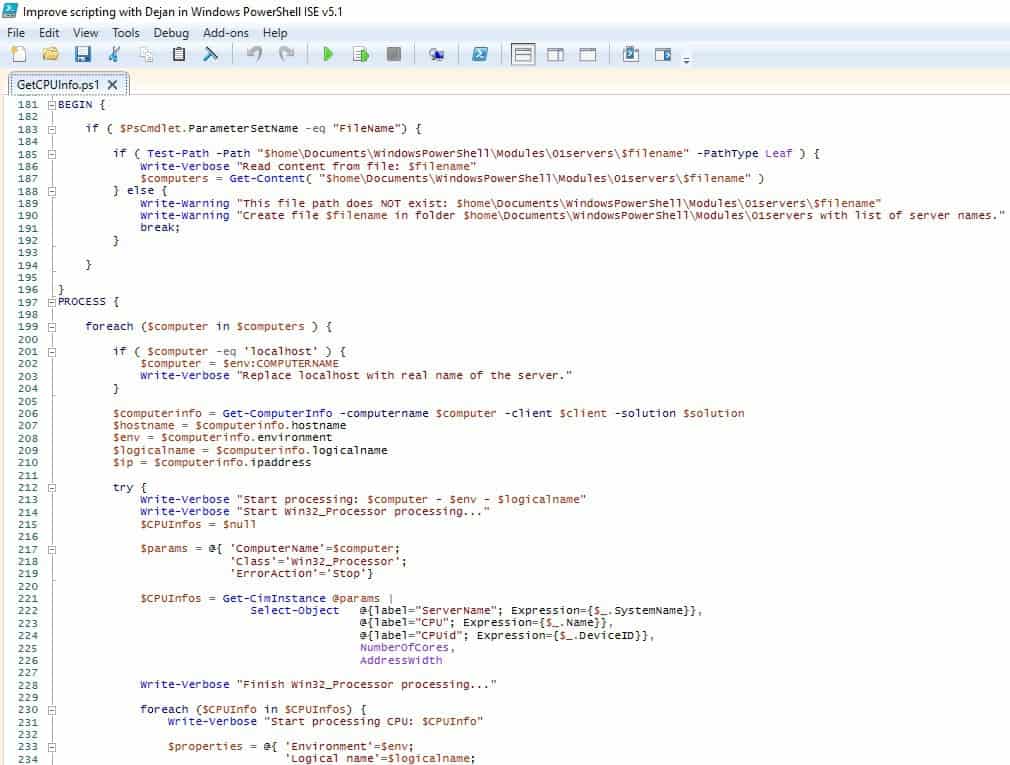
Here is the code of Get-CPUInfo CmdLet and how I implement Write-Verbose CmdLet that will show the messages when CmdLet is run with Verbose Common Parameter.
Useful Commands And Keyboard Shortcuts
List of useful keyboard shortcuts.
| Command | Keyboard Shortcut | Console Pane Shortcut |
|---|---|---|
| Toggle Breakpoint | F9 | |
| Run/Continue | F5 | Type C and then press ENTER to continue debugging |
| Step Into | F11 | Type S and then press ENTER to continue debugging |
| Step Over | F10 | Type V and then press ENTER to continue debugging |
| Step Out | Shift + F11 | Type O and then press ENTER to continue debugging |
| Stop Debugger | Shift + F5 | Type Q and then press ENTER to continue debugging |
| Remove All Breakpoints | Ctrl + Shift + F9 | |
| List Breakpoints | Ctrl + Shift + L | |
| Display Call Stack | Ctrl + Shift + D | Type K and then press ENTER to continue debugging |
| Break All | Ctrl + B | |
| Go to Console Pane | Ctrl + D | |
| Go to Script Pane | Ctrl + I |
Call Stack displayed:
Get-PSCallStackList the breakpoints:
Get-PSBreakpointSet a breakpoint on a function:
Set-PSBreakpoint -Script .\Documents\WindowsPowerShell\Modules\03common\GetCPUInfo.ps1 -Command Get-ComputerInfoDisable breakpoints:
Get-PSBreakpoint | Disable-PSBreakpointEnable breakpoints:
Get-PSBreakpoint | Enable-PSBreakpointList the breakpoints:
Get-PSBreakpoint | Select-Object ID, Enabled, Line, Command, Variable, AccessMode, HitCount, @{label="Script"; Expression={$_.Script.Substring( $_.Script.LastIndexOf("\") + 1 )}} | Out-GridViewRemove breakpoints (Remember this is a destructive command so be careful):
Get-PSBreakpoint | Remove-PSBreakpointUseful PowerShell Debugging Articles
Here are some useful articles and resources: